Although right now most of the world keep as static as possible to slow down the spread the fatal COVID-19 virus, the battle of finding the cure is never stopped. The key to win this unprecedented war against virus relies heavily on leveraging the data at hand to identify the source of infection, understand how virus is spread and protect community from being infected. So far, contact tracking has been agreed to be one of the most effective methods to manage the situation from getting worse.
And timing is critical.
Governments, organizations and even individuals need a way to track people and places at risk. The numbers of confirmed cases released everyday are not enough. The capability to link details of those cases with information of who, where, when and how becomes more important than ever to provide timely and actionable reactions and predictions. Obviously this is a perfect problem for a graph solution.
Using publicly available case data (without identity info), based on some ideas from the Neo4j community as well as government agencies, I spent the Friday evening to build this solution using Neo4j Bloom to help answer (yes, in natural language) several key questions of contact tracking. Here are how I did this.
1. Loading The Data
In order to gain insights of how virus has been spreading among people, we need individual case data rather than summary of case numbers. In fact, Kaggle has initiated the COVID-19 Challenge and published individual case data, which can be found here: UNCOVER COVID-19 Challenge
2 data files can also be found from the Githubrepository of this project. The file layouts are simple to understand and the following are Cypher LOAD CSV statement to load data into Neo4j:
// Load individual case data of Canada file by Kaggle
USING PERIODIC COMMIT 1000
LOAD CSV WITH HEADERS FROM 'file:///individual-level-cases.csv' AS line
MERGE (p:State:Canada{name:line.province})
CREATE (c:Case:Canada{caseId:line.case_id})
SET c.ageGroup = line.age, c.healthRegion = line.health_region, c.reportDate = line.date_report,
c.acquireMethod = line.locally_acquired, c.acquireSource = line.travel_history_country, c.source = line.case_source,
c.sex = line.sex, c.state= line.province, c.community = line.community,
c.linkedCase = line.linked_case
MERGE (c) -[:LIVES_IN]-> (p)
WITH c,p,split(line.travel_history_country,',') AS places
UNWIND places AS place
MERGE (pl:Place{name:trim(place)})
MERGE (c) -[:HAS_VISITED]-> (pl)
// Load indivudual case file of Korea:
USING PERIODIC COMMIT 1000
LOAD CSV WITH HEADERS FROM 'file:///PatientInfo.csv' AS line
MERGE (p:State:South Korea{name:line.province})
CREATE (c:Case:South Korea{caseId:line.patient_id})
SET c.ageGroup = line.age, c.healthRegion = line.city, c.reportDate = line.confirmed_date,
c.acquireMethod = line.infection_case, c.acquireSource = line.infection_case, c.deceasedDate = line.deceased_date,
c.sex = line.sex, c.state= line.province, c.linkedCase = line.infected_by, c.state = line.state
MERGE (c) -[:LIVES_IN]-> (p)
And we want to give all deceased cases an extra label too:
MATCH (c:Case)
WHERE c.state = 'deceased'
SET c:Deceased
And don't forget creating some indices:
CREATE INDEX ON :Case(caseId);
CREATE INDEX ON :Case(reportDate);
CREATE INDEX ON :Case(sex);
The data model is very simple too.

2. Building Queries in Bloom
To use Bloom, you can install and launch it from with Neo4j Desktop. There is also a Bloom server plugin to run from Neo4 database server. Bloom can be requested from here.
The beauty of Bloom, other than its visualization of graph, is its natural language style search. For example, to find out all cases living in Seoul, you can simply type: "case lives_in Seoul":

Remember the data model above? Case is the label name and LIVES_IN the relationship type name. While you are typing, Bloom automatically searches metadata and indices in Neo4h database to find the best matches.
Bloom has a lot of exciting features. The one I prefer, and always amazed others, is its Search Template feature. Search Template is a pre-defined Cypher query with a search phrase for other users to look up and execute it. It usually more complex, and supports parameters.
For example, you can define a query to find out all confirmed cases in a place.

The Search Phrase has 2 parameters: $place and $date. The actual Cypher query is like:
MATCH path = (c:Case) -[:LIVES_IN]-> (p:State)
WHERE c.reportDate = $date AND p.name = $place
RETURN path;
I think it is self-explainable enough. The candidate values for parameter $place are from name property of State nodes. Once this template is saved, all you need to do to execute it is by typing something like: "Show confirmed cases in Seoul on 2020-03-01" and hit Enter key. Is it cool?
3. Key Questions to Answer
Here are some useful searches.
Q: How did the case #2000000019 get infected?
A: Show ultimate source of a case 2000000019.
Cypher:
MATCH path = (c:Case{caseId:$case}) -[:INFECTED_FROM*]-> (c1)
WITH path, size(nodes(path)) AS distance
ORDER BY distance DESC LIMIT 1
RETURN path

Q: Who was the patient zero for the region?
A: Show the Super Spreader
Cypher:
MATCH (c:Case)
WITH c, size((c) <-[:INFECTED_FROM]- ()) AS degree
ORDER BY degree DESC LIMIT 1
WITH c
MATCH path = (c) <-[:INFECTED_FROM*]- (c2)
RETURN path;

Q: How did confirmed cases evolve overtime?
A: Show all confirmed cases till xxxx-xx-xx (no need for a time slider, seriously)
Cypher:
MATCH (c:Case)
WHERE exists(c.reportDate) AND c.reportDate <= $date
OPTIONAL MATCH (c) -[r:INFECTED_FROM]-> (c1)
RETURN c,r,c1;

On the graph, blue dots are cases, and bigger grey ones are deceased ones. Red lines between dots are the infection route. This is done by Conditional Styling in Bloom.
4. A step further: adding locations
In order for effective contact tracking, we would need location data of where people have been to, and when. Thanks to my colleague, Rik Van Bruggen, who created some simulated location data to make this a more convincing and appealing solution.
Disclaimer: all names seen in the data set are NOT of real people.
Here is the model:

And Cypher statement to load data:
//import the persons
load csv with headers from
"https://docs.google.com/spreadsheets/u/0/d/1R-XVuynPsOWcXSderLpq3DacZdk10PZ8v6FiYGTncIE/export?format=csv&id=1R-XVuynPsOWcXSderLpq3DacZdk10PZ8v6FiYGTncIE&gid=0" as csv
create (p:Person {id: csv.PersonId, name:csv.PersonName, healthstatus:csv.Healthstatus, confirmedtime:datetime(csv.ConfirmedTime)});
//import the places
load csv with headers from
"https://docs.google.com/spreadsheets/u/0/d/1R-XVuynPsOWcXSderLpq3DacZdk10PZ8v6FiYGTncIE/export?format=csv&id=1R-XVuynPsOWcXSderLpq3DacZdk10PZ8v6FiYGTncIE&gid=205425553" as csv
create (p:Place {id: csv.PlaceId, name:csv.PlaceName, type:csv.PlaceType, location:point({x: toFloat(csv.Lat), y: toFloat(csv.Long)})});
// Speed up match by creating indices
create index on :Place(id);
create index on :Place(location);
create index on :Place(name);
create index on :Person(id);
create index on :Person(name);
create index on :Person(healthstatus);
create index on :Person(confirmedtime);
//import the stays
load csv with headers from
"https://docs.google.com/spreadsheets/u/0/d/1R-XVuynPsOWcXSderLpq3DacZdk10PZ8v6FiYGTncIE/export?format=csv&id=1R-XVuynPsOWcXSderLpq3DacZdk10PZ8v6FiYGTncIE&gid=1261126668" as csv
match (p:Person {id:csv.PersonId}), (pl:Place {id:csv.PlaceId})
create (p)-[:STAYED_AT]->(s:Stay {id:csv.StayId, starttime:datetime(csv.StartTime), endtime:datetime(csv.EndTime)})-[:LOCATED_AT]->(pl);
5. Tracking Contacts of Confirmed Cases
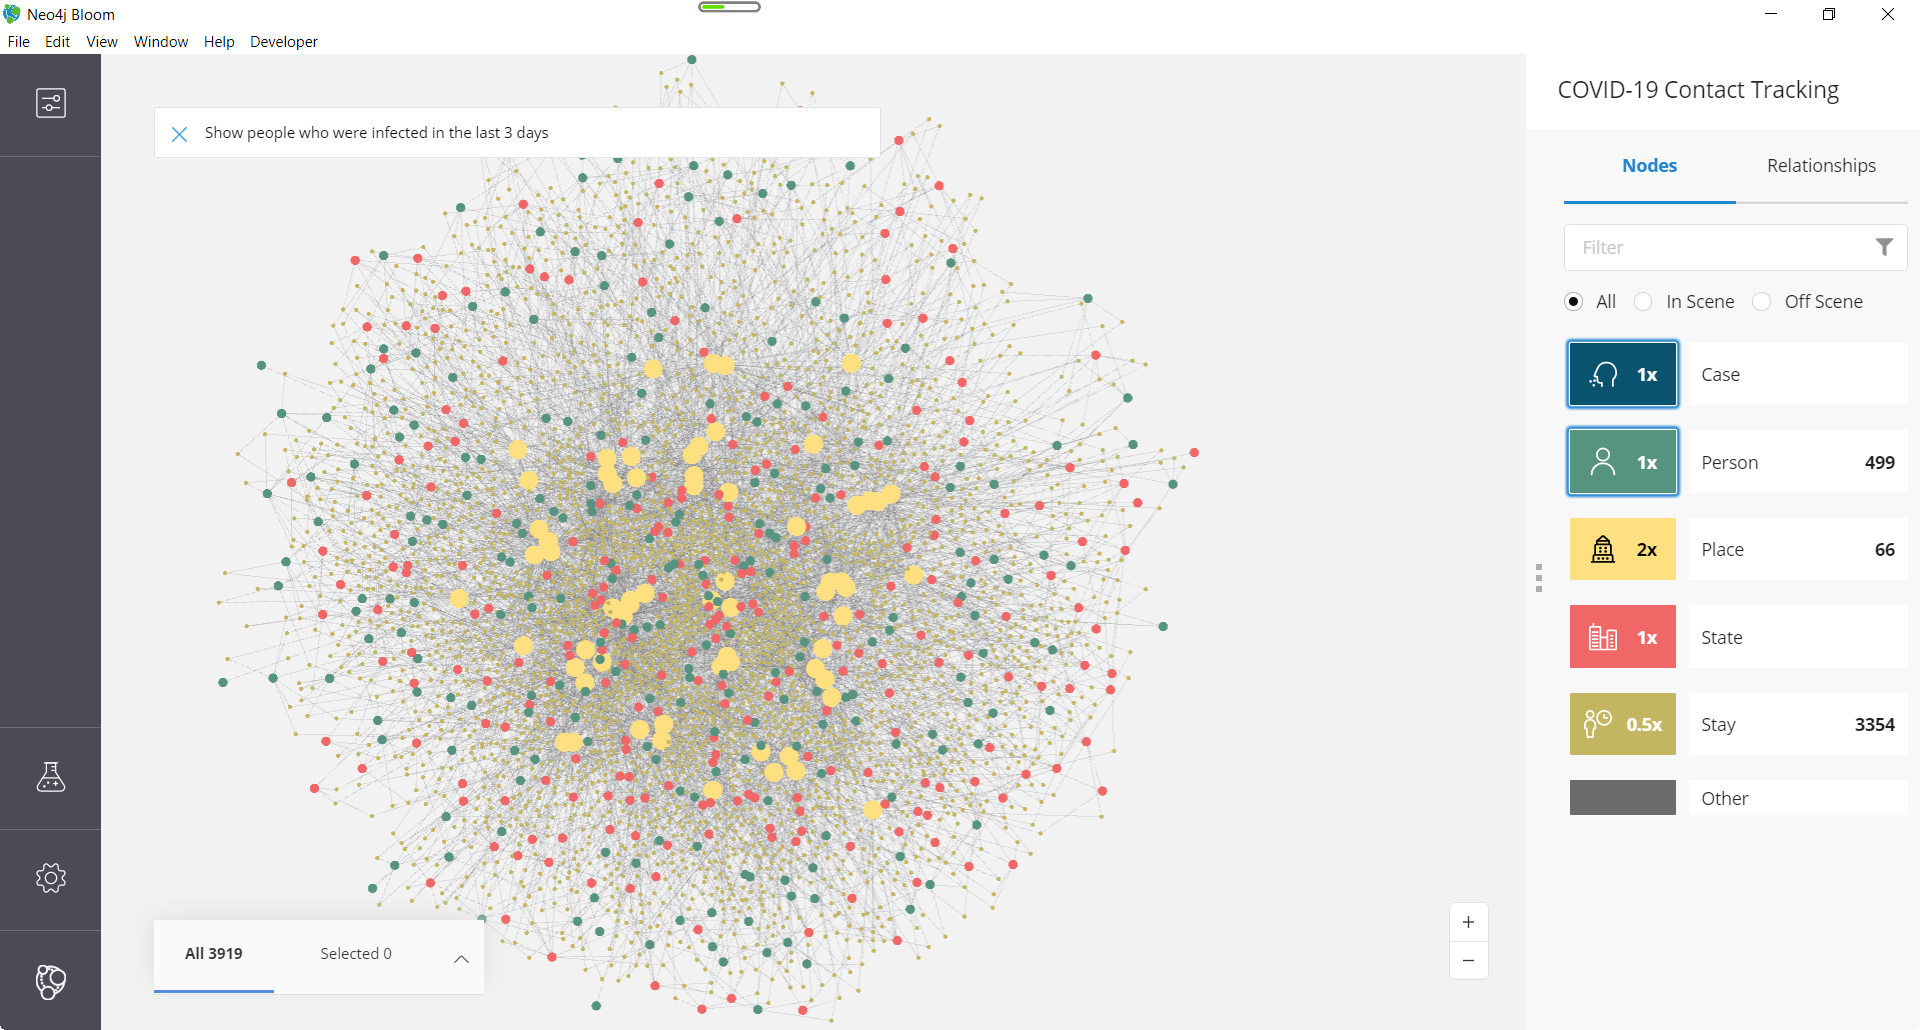
Q: Who have been infected in the last 3 days, and where have they been to? Further more, who may be of higher risk because they have also visited those places?
A: Show people who were infected in the last 3 days
Cypher:
MATCH (p:Person)
WHERE p.healthstatus = 'Sick' AND duration.inDays(p.confirmedtime, datetime()) + datetime() < duration({days:$num}) + datetime()
RETURN p;
It turned out 13 persons were infected, who had 105 stays at 66 places. Those places have had
3249 stays by 486 other people (un-tested or un-confirmed), who now may have been exposed to high risk.
Please note the use of Duration data type above. You can find more details of Duration data in Neo4j Cypher online manual.
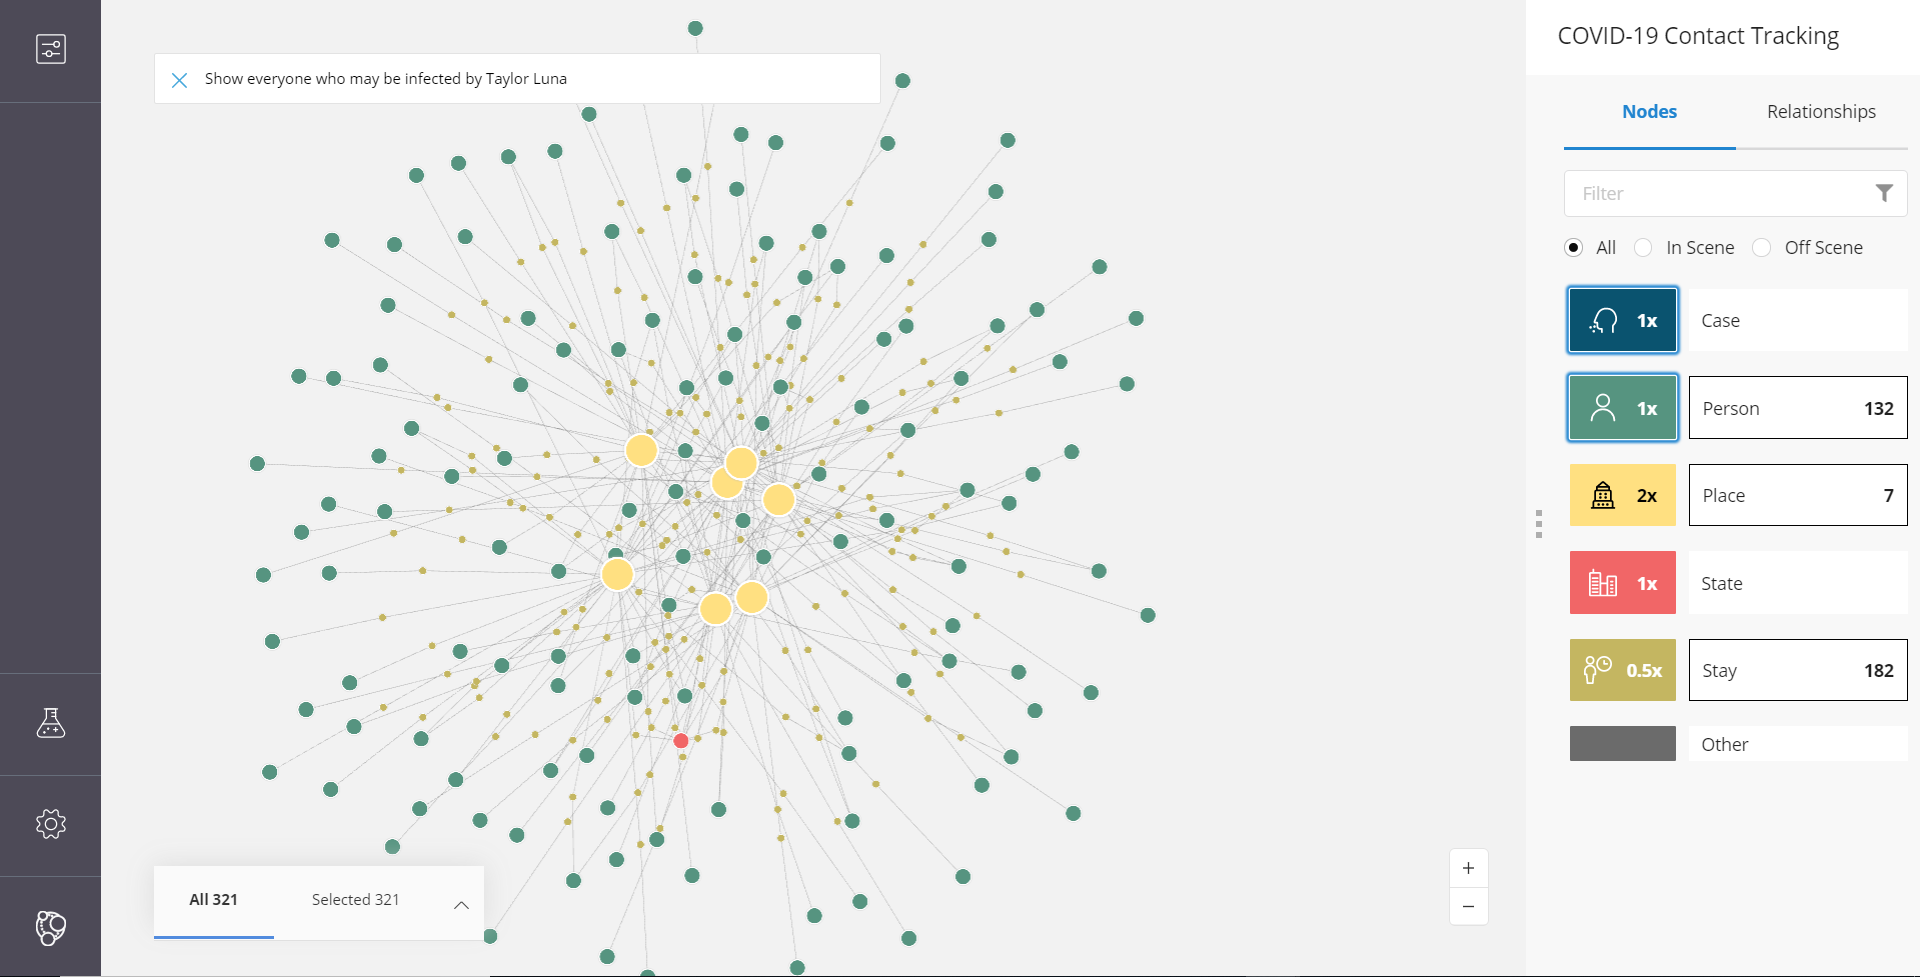
Q: For a confirmed case, who are at risk now?
A: Show everyone who may be infected by XXX.
Cypher:
match (p:Person {name:$name})
with p
limit 1
match path= (p)--(s1:Stay)--(pl:Place)--(s2:Stay)--(p2:Person {healthstatus:"Healthy"})
return path;
Plus, there are a lot more that can be done.
So can we also see cases on map? Of course, with Neo4j the answer is (always) YES. There is a Graph Application called Neomap, developed by Estelle Scifo, which exactly serves this purpose. To make it work only takes some minutes, if you follow this article - Introducing Neomap.

Summary
So it was about 24 hours, during which I spent to build all of this, with the help from my colleagues for data and ideas, and I made it! Everything created is shared through Github, including the sample database, Cypher script, Bloom perspective file which contains styling and search templates.
Fighting against pandemic is an on-going effort, which requires contributions from not just government agencies and medical workers, but also normal people by staying at home and following healthy life style. The great thing is, we can also contribute by staying at home and doing something using our knowledge and technology like graph. From the most recent GraphHack Graphs4Good program organized by Neo4j, there are already quite some projects that are creating promising outcomes.
We are also supporting those initiatives that use Neo4j graph database technology to build solution like contact tracking for general public, R&D institutions and governments by offering free subscription license of Neo4j Enterprise DBMS. Please do ask us if you have need.
Go Graph4good!