Two equivalent queries (different node label) performing very differently

My neo4j database has been loaded via NeoSemantics. This means that every node has a “Resource” label and also has its own label depending on the type of object. For each node I’ve also added an internalId field that is unique across all nodes in the graph.

Here is my first query:
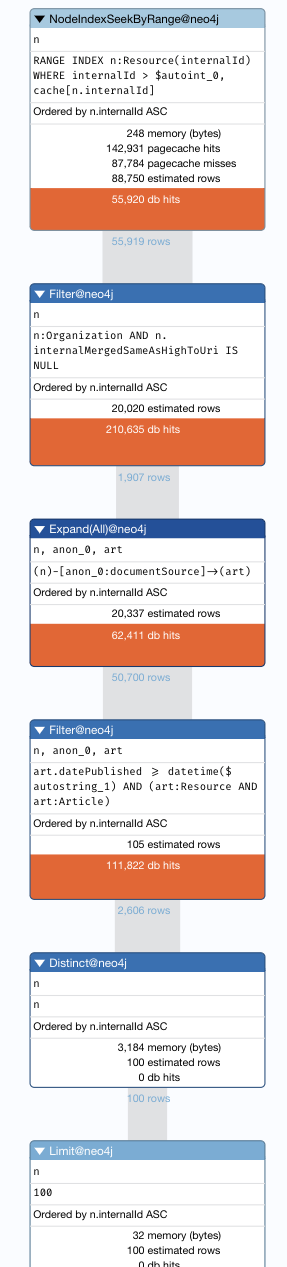
PROFILE 
MATCH (n:Resource&Organization)-[:documentSource]->(art: Resource&Article)
WHERE n.internalId > 0
AND art.datePublished >= datetime('2025-07-01')
AND n.internalMergedSameAsHighToUri IS NULL
RETURN DISTINCT(n)
ORDER BY n.internalId
LIMIT 100

This performs ok: planner: COST, runtime: PIPELINED. 441936 total db hits in 8932 ms.

But when I try the equivalent query with another label, e.g:

PROFILE 
MATCH (n:Resource&AboutUs)-[:documentSource]->(art: Resource&Article)
WHERE n.internalId > 0
AND art.datePublished >= datetime('2025-07-01')
AND n.internalMergedSameAsHighToUri IS NULL
RETURN DISTINCT(n)
ORDER BY n.internalId
LIMIT 100

The performance degrades dramatically: planner: COST, runtime: PIPELINED. 10152421 total db hits in 35352 ms.

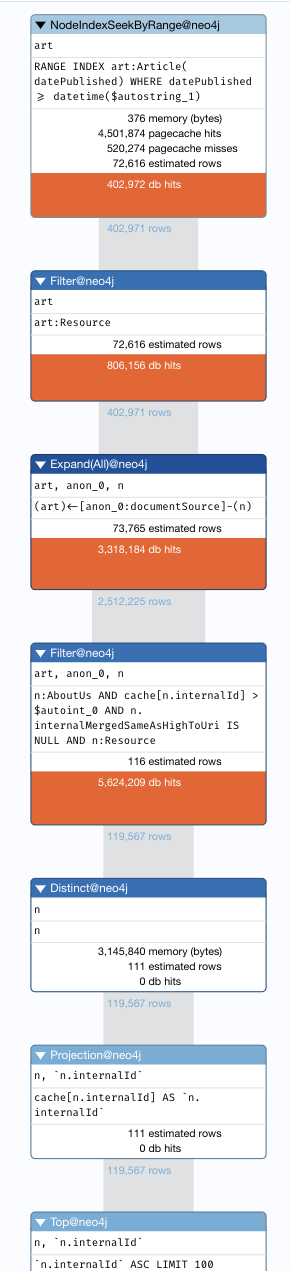
Interestingly, this uses a different index to start its query.

I then tried to hint to use the same index as the Resource&Organization query, like so:

PROFILE
MATCH (n:Resource&AboutUs)-[:documentSource]->(art: Resource&Article)
USING INDEX n:Resource(internalId)
WHERE n.internalId > 0
AND art.datePublished >= datetime('2025-07-01')
AND n.internalMergedSameAsHighToUri IS NULL
RETURN DISTINCT(n)
ORDER BY n.internalId
LIMIT 100

This helped a bit but it's still pretty dire by comparison: planner: COST, runtime: PIPELINED. 34836518 total db hits in 25676 ms.

Some context:
There are about 1.5m matching Organization nodes, of which each one could have many (>10) Articles attached. There are about 1 million matching AboutUs nodes, each of which is only likely to have 1 Article attached.

My question: What can I do to optimize these queries, or at least make them work to a similar level of quality?

@alanbuxton

is there any details of what Neo4j version?

Ah yes sorry for that. It's 5.20

Running in Neo4j Desktop

Even more bizarre.

Today the same query, with the same database, is performing a lot faster.

PROFILE 
MATCH (n:Resource&AboutUs)-[:documentSource]->(art: Resource&Article)
WHERE n.internalId > 0
AND art.datePublished >= datetime('2025-07-01')
AND n.internalMergedSameAsHighToUri IS NULL
RETURN DISTINCT(n)
ORDER BY n.internalId
LIMIT 100

planner: COST, runtime: PIPELINED. 10152421 total db hits in 3503 ms.

Run CALL db.stats.retrieve('GRAPH COUNTS') to check cardinalities

Hi @Froums here is the output:

{
  "nodes": [
    {
      "count": 14029405
    },
    {
      "count": 14029404,
      "label": "Resource"
    },
    {
      "count": 4219668,
      "label": "Organization"
    },
    {
      "count": 2457379,
      "label": "Article"
    },
    {
      "count": 29578,
      "label": "GeoNamesLocation"
    },
    {
      "count": 1500,
      "label": "IndustryCluster"
    },
    {
      "count": 1,
      "label": "_GraphConfig"
    },
    {
      "count": 633692,
      "label": "CorporateFinanceActivity"
    },
    {
      "count": 74708,
      "label": "LocationActivity"
    },
    {
      "count": 71357,
      "label": "Site"
    },
    {
      "count": 259065,
      "label": "Person"
    },
    {
      "count": 278055,
      "label": "Role"
    },
    {
      "count": 309572,
      "label": "RoleActivity"
    },
    {
      "count": 408683,
      "label": "PartnershipActivity"
    },
    {
      "count": 219935,
      "label": "ProductActivity"
    },
    {
      "count": 258999,
      "label": "Product"
    },
    {
      "count": 271511,
      "label": "MarketingActivity"
    },
    {
      "count": 103837,
      "label": "EquityActionsActivity"
    },
    {
      "count": 190046,
      "label": "OperationsActivity"
    },
    {
      "count": 214967,
      "label": "FinancialsActivity"
    },
    {
      "count": 58531,
      "label": "RegulatoryActivity"
    },
    {
      "count": 15110,
      "label": "IncidentActivity"
    },
    {
      "count": 105498,
      "label": "FinancialReportingActivity"
    },
    {
      "count": 9907,
      "label": "AnalystRatingActivity"
    },
    {
      "count": 66,
      "label": "RecognitionActivity"
    },
    {
      "count": 1007288,
      "label": "AboutUs"
    },
    {
      "count": 371162,
      "label": "IndustrySectorUpdate"
    }
  ],
  "indexes": [
    {
      "indexProvider": "token-lookup-1.0",
      "indexType": "LOOKUP",
      "updatesSinceEstimation": 0,
      "labels": [],
      "properties": [],
      "totalSize": 0,
      "estimatedUniqueSize": 0
    },
    {
      "indexProvider": "token-lookup-1.0",
      "indexType": "LOOKUP",
      "updatesSinceEstimation": 0,
      "relationshipTypes": [],
      "properties": [],
      "totalSize": 0,
      "estimatedUniqueSize": 0
    },
    {
      "indexProvider": "range-1.0",
      "indexType": "RANGE",
      "updatesSinceEstimation": 184736,
      "labels": [
        "Resource"
      ],
      "properties": [
        "uri"
      ],
      "totalSize": 13841235,
      "estimatedUniqueSize": 13841235
    },
    {
      "indexProvider": "range-1.0",
      "indexType": "RANGE",
      "updatesSinceEstimation": 414714,
      "labels": [
        "Resource"
      ],
      "properties": [
        "internalDocId"
      ],
      "totalSize": 11092964,
      "estimatedUniqueSize": 2368567
    },
    {
      "indexProvider": "range-1.0",
      "indexType": "RANGE",
      "updatesSinceEstimation": 26831,
      "labels": [
        "Resource"
      ],
      "properties": [
        "internalMergedSameAsHighToUri"
      ],
      "totalSize": 2706672,
      "estimatedUniqueSize": 427547
    },
    {
      "indexProvider": "range-1.0",
      "indexType": "RANGE",
      "updatesSinceEstimation": 36925,
      "labels": [
        "Article"
      ],
      "properties": [
        "datePublished"
      ],
      "totalSize": 2420463,
      "estimatedUniqueSize": 1444435
    },
    {
      "indexProvider": "range-1.0",
      "indexType": "RANGE",
      "updatesSinceEstimation": 5252,
      "labels": [
        "Resource"
      ],
      "properties": [
        "internalMergedActivityWithSimilarRelationshipsToUri"
      ],
      "totalSize": 180272,
      "estimatedUniqueSize": 151575
    },
    {
      "indexProvider": "range-1.0",
      "indexType": "RANGE",
      "updatesSinceEstimation": 0,
      "labels": [
        "GeoNamesLocation"
      ],
      "properties": [
        "countryCode",
        "admin1Code"
      ],
      "totalSize": 29558,
      "estimatedUniqueSize": 2427
    },
    {
      "indexProvider": "vector-2.0",
      "indexType": "VECTOR",
      "updatesSinceEstimation": 0,
      "labels": [
        "IndustryCluster"
      ],
      "properties": [
        "representative_doc_embedding"
      ],
      "totalSize": 0,
      "estimatedUniqueSize": 0
    },
    {
      "indexProvider": "vector-2.0",
      "indexType": "VECTOR",
      "updatesSinceEstimation": 0,
      "labels": [
        "Organization"
      ],
      "properties": [
        "industry_embedding"
      ],
      "totalSize": 0,
      "estimatedUniqueSize": 0
    },
    {
      "indexProvider": "range-1.0",
      "indexType": "RANGE",
      "updatesSinceEstimation": 91535,
      "labels": [
        "Resource"
      ],
      "properties": [
        "internalId"
      ],
      "totalSize": 13921419,
      "estimatedUniqueSize": 13921419
    }
  ],
  "constraints": [
    {
      "label": "Resource",
      "properties": [
        "uri"
      ],
      "type": "Uniqueness constraint"
    }
  ],
 
... etc

(truncated to not make the message any longer). Is this helpful?

A node is an element in a data structure, like a graph

MATCH (n:Resource&AboutUs)
WHERE n.internalId > 0
AND n.internalMergedSameAsHighToUri IS NULL

MATCH(n)-[:documentSource]->(art: Resource&Article)
WHERE art.datePublished >= datetime('2025-07-01')

RETURN n
LIMIT 100

Can you try with this query ?
I removed the order by to eliminate the fact that Neo4j has to pull all the results to order.

It sounds a problem of cardinality between AboutUs and Article nodes.
There is defintely more elements to read from the database in the second query.

If you have all the elements in cache, the query will run faster. On the second run, the number of db hits is the same.

If you run call apoc.meta.stats(), you will have a clear idea of what’s in your database

A couple of points I can think of.

  1. Resource label is on all nodes. Maybe don't include that label and let the other labels differentiate the nodes more. You will need to add indexes for each label/property pair that you are using for querying on for identifying anchor nodes in your query. In this case :Organization(internalId) and possibly :Article(datePublished).
  2. Your WHERE clause n.internalId > 0 doesn't seem very discriminatory. Do you have a lot of nodes with values less than or equal to zero?
  3. Since you are not returning the Article nodes, maybe using an EXISTS predicate would be more performant, as it will just find the first instance that exists and stop looking, versus finding all related nodes and increasing the result set for each. This will reduce the memory requirements to maintain the result set, reduce the time to build the result set to include each Article node, and eliminates the need for the DISTINCT operation. You needed the DISTINCT because each 'n' node would be include in the result for every related Article node.

Try this:

MATCH (n:Organization)
WHERE n.internalId > 0
AND n.internalMergedSameAsHighToUri IS NULL
AND EXISTS {
    MATCH (n)-[:documentSource]->(art:Article)
    WHERE art.datePublished >= datetime('2025-07-01')
}
RETURN n
ORDER BY n.internalId
LIMIT 100

Thanks for the suggestions.

Re your questions:

  1. I tried to create an index on Organization internalId but the query then did more database hits when using the index on Resource internalId
  2. WHERE n.internalId > 0 is a trick I stumbled upon to make sure that neo4j used this index. Without this the query doesn't complete (or at least I killed it after 3-4 minutes)
  3. Thanks for the subquery idea - this definitely helped.

In my playing around with various ideas I also stumbled on the case that

MATCH (n:Resource&Organization) 
etc etc

Performed worse than

MATCH (n:Resource)
WHERE "Organization" IN LABELS(n)

Very weird.

I wrote about my journey here When two similar Neo4j queries work very differently – Be good, work hard, get lucky

I am still flummoxed why with two very similar queries, the one with fewer relevant matches (1 million AboutUs) did something like 20-30 million db hits whereas the one with a larger number of relevant matches (4.5 million Organizations) did something like 300 thousand db hits.

I am not sure of the usefulness of the trick. You want predicates that filter out the most data, so the result set is smallest or an index can really be applicable. It seems that you are not really looking for nodes with that id > 1. I also think you should try eliminating the Resource label, as it is applied to all nodes. As such, I don't think it helps much.

Maybe try this query with an index on : Organization(n.internalMergedSameAsHighToUri)

MATCH (n:Organization)
WHERE n.internalMergedSameAsHighToUri IS NULL
AND EXISTS {
    MATCH (n)-[:documentSource]->(art:Article)
    WHERE art.datePublished >= datetime('2025-07-01')
}
RETURN n
ORDER BY n.internalId
LIMIT 100

Ok, I don't think the above will help. I tested an index to see if it would work with null values, as some databases don't work with columns that have nulls. My observation was that a query with a predicate looking for 'not null' values utilized the index, while a predicate looking for 'null' values did not.

It doesn't seem like you have an attribute(s) that you can use in your predicate to quickly filter the nodes to find the ones you want using an index.

Is this a data remediation script that you run once in a while? If not, can you set the uri property to a default value that you could interpret as not set (instead of null)? then an index would work.

1 Like

Hi Gary thanks for looking further into this.

I did try the index on organization with the query you suggested just to see how things would work out.

planner: COST, runtime: PIPELINED. 62761555 total db hits in 301568 ms

And it didn't use the index.

This script is a back-end task that runs daily in the background so the performance of this one is not such a big problem.

The main reason I opened this post was to ask why two very similar queries performed so differently.

Based on the best-performing variants I have so far:

PROFILE 
MATCH (n:Resource)
WHERE n.internalId > 0
AND n.internalMergedSameAsHighToUri IS NULL
AND "Organization" IN LABELS(n)
AND EXISTS {
    MATCH (n)-[:documentSource]->(art:Article)
    WHERE art.datePublished >= datetime('2025-07-01')
}
RETURN n
ORDER BY n.internalId
LIMIT 100

305,000 db hits (which actually is not that big of a problem - I have bigger fish to fry than tune this more)

But one small change - just a different label:

PROFILE 
MATCH (n:Resource)
WHERE n.internalId > 0 
AND n.internalMergedSameAsHighToUri IS NULL
AND "AboutUs" IN LABELS(n)
AND EXISTS {
    MATCH (n)-[:documentSource]->(art:Article)
    WHERE art.datePublished >= datetime('2025-07-01')
}
RETURN n
ORDER BY n.internalId
LIMIT 100

35 million db hits

The only difference is the label Organization vs the label AboutUs

There are 4.5 million Organizations and 1 million AboutUs (15 million nodes overall).