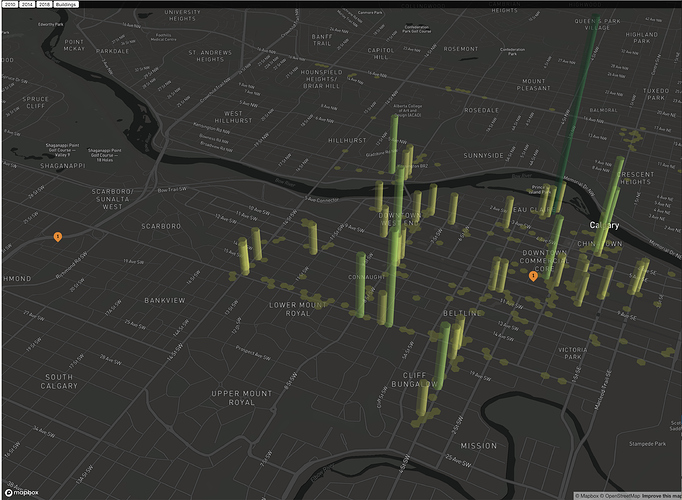
Greetings! Menome Technologies does a lot of work with clients who have need for spatial analytics. The addition of spatial capabilities to Neo4j therefore has been of tremendous value to the equation for the work we do. We feel that the combination of spatial capabilities and graph modelling - not to mention the other powerful aspects of NLP, full text indexing and graph algorithms makes Neo4j a unique and powerful force for disrupting the world of GIS which hasn't had a major change in terms of how data are handled in many years.
I wanted therefore to start a series of posts on the subject sharing out some of the things we see and are working on in terms of graph/spatial analysis, and also visualizations of spatial data.
This first post goes through a fairly simple but interesting (and directly applicable for a client) example of using neo4j to compute Walk Scores. Walk Score is a well known, published algorithm, so makes a good starting point for working up some applied examples of spatial analysis. I haven't done extensive testing on it, but the results do match those on the Walk Score website for the two points I tested with.
Details and Code are here:
https://github.com/menome/neo4j-spatial-experiments
Let me know if you have any questions, have ideas of how I could do this better or if you discover a mistake or omission in my approach to translating the algorithm to Cypher.
Cheers!
Mike Morley...
Founder Menome Technologies...
