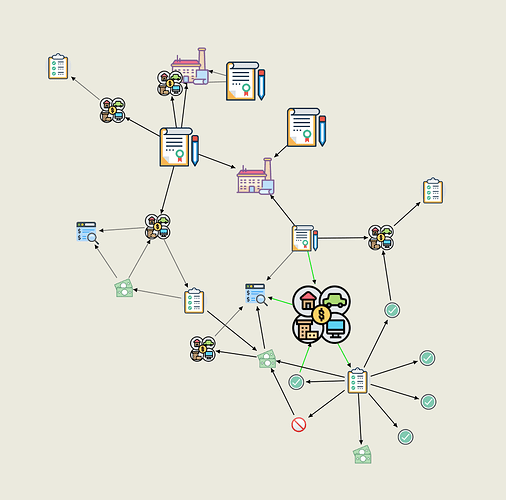
Visualization graphs of Neo4j using Neovis.js in other web applications for end consumers/users. This graph visualisation ought to resemble either Neo4J Bloom or Neo4J Browser. It implies that a graph need to be dynamic or extendable. It will employ graph capabilities to improve the end user experience. Could you tell me how to go about achieving that or any other suggestions on this?
Do you mean this:
It also will depend on what is your objective, I use 2 libraries (for different reasons):
Go.JS is paid, but super flexible and provides a lot (that's a graph of a product catalogue, took < 200 ms to render)
This second library is VivaGraph and it is good for smaller, detailed graphs:
Thanks for sharing this.
Here, I want to utilise a graph that looks similar to what the Neo4j browser displays. In other words, the graph needs to be user-interactive in web-application, just like the Neo4J browser. It should not static. Is it possible achieve here ?
All of those libraries are 'programmable' - depends on how custom you want it. In my first example i want a hierarchical graph with a bit of information / in the second i want icon-based for differentiation.
things like 'click-and-expand' might depend on your use case (in mine, depending on the semantic value of a node, i might choose to expand by 1 edge, in others i might do more than 1 levels').
Programming is probably easier for you (I have 4 different views for different reasons), and it also depends on your budget.
I also have bookmarked - Network graph | Flourish but I think Go.JS is the best because it does more than just graph outputs.
Thank you ! I have started using below Neo4j Visualization Libraries (NVL):
thanks for sharing @spati112, I’m also looking into NVL as bloom does not provide API for user interaction tracking.
I only found limited reference for this js library and the visualization is more suitable for population level visualization and the node level expansion all happens in the round circle as below - so just wanted to hear more about your evaluation of the tool. Thanks!


